Backtested · Reproducible · Open methodology
Aggregate. Navigate.
Step Back From
Price Charts
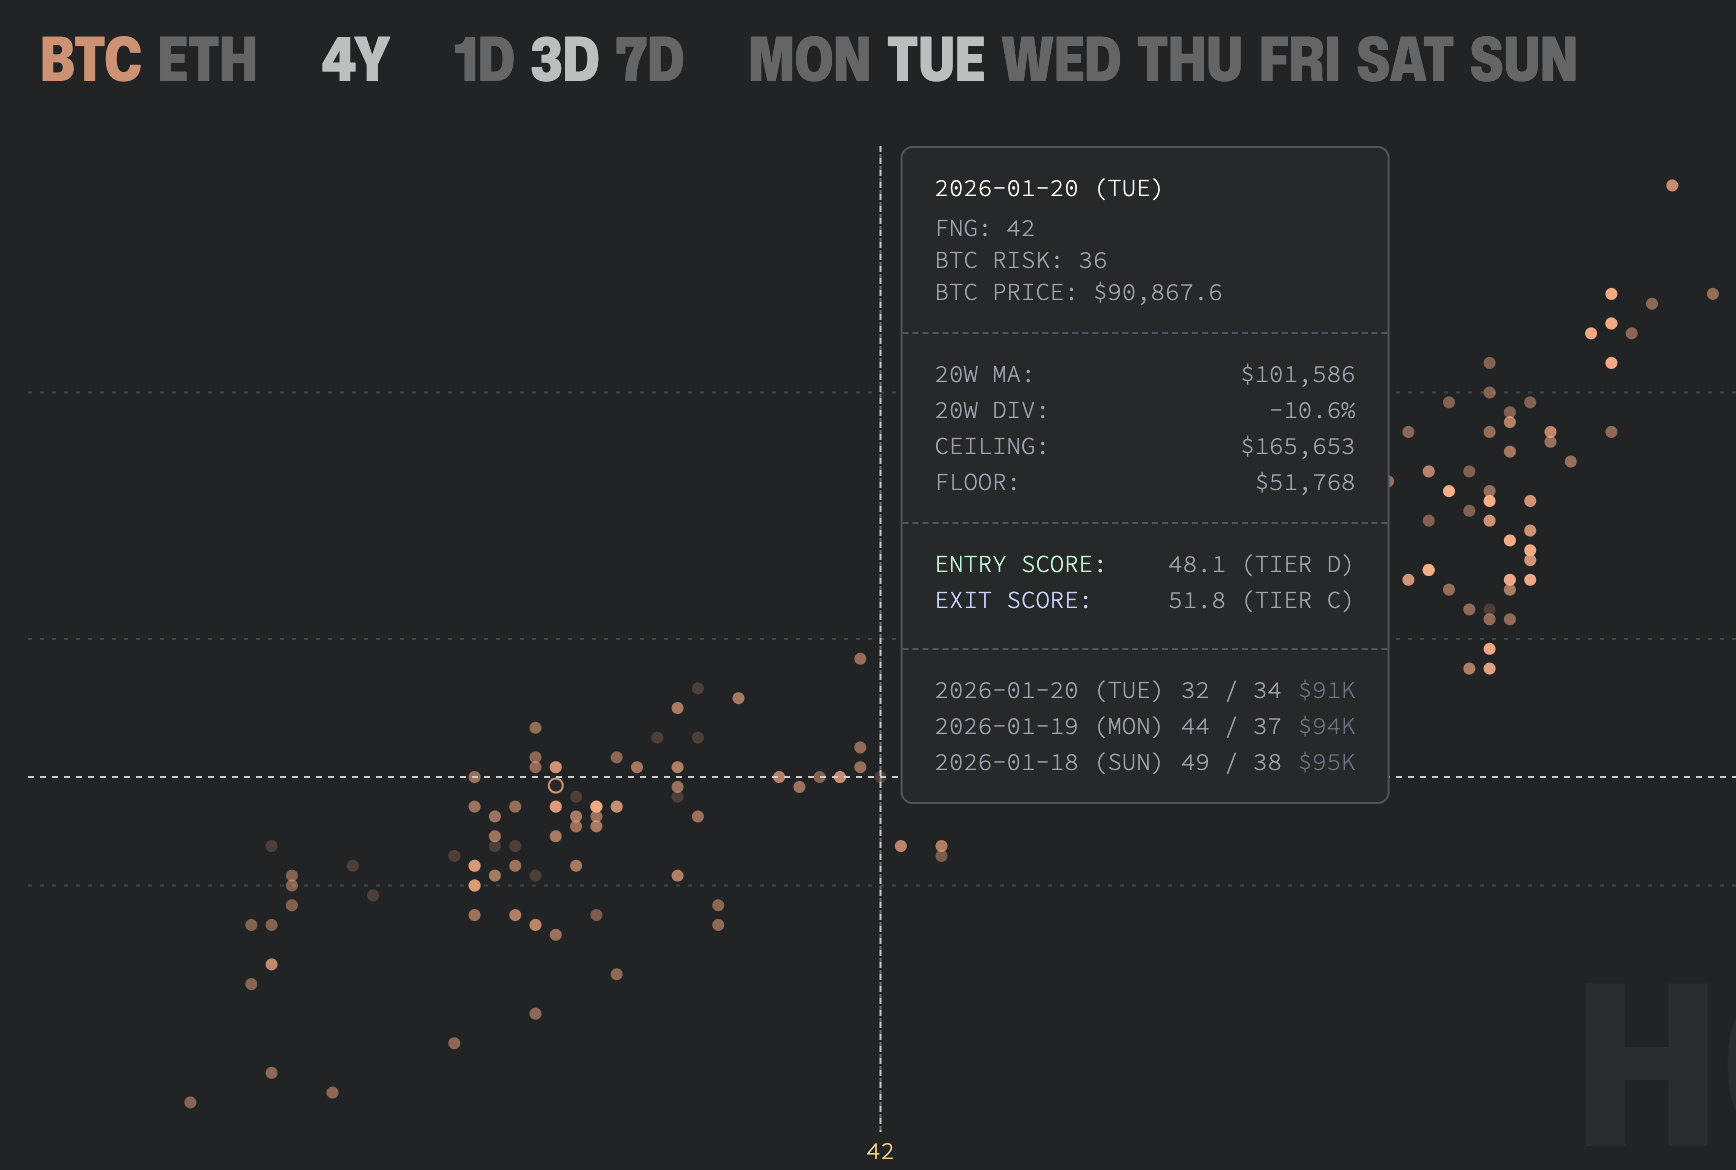
Most tools show sentiment as a timeline. Hashwake maps sentiment to risk. Navigate the market in aggregate — 8 years of data reveal patterns price charts can't show.
2,900+
daily observations
14
identified clusters
30/60/90d
forward window
Live data
Transparent Methodology
Sentiment-to-risk correlation, not just sentiment history.
Reproducible metrics. Full distributions, not cherry-picked highlights.
Data Pipeline
- 01Fear & Greed Index: daily sentiment aggregation since 2018
- 02Price data: daily close from CoinGecko (BTC, ETH)
- 03Risk metric: normalized deviation from 140-day moving average
- 04Volatility: 20-day rolling standard deviation
Statistical Framework
- 01Cluster analysis identifies recurring sentiment-risk regimes
- 02Forward returns measured at 30, 60, 90-day horizons
- 03Win rates and return distributions per cluster
- 04Sample sizes noted — interpret accordingly
8
years backtested against forward returns
14
sentiment-risk regimes with measured outcomes
5
tier entry/exit scoring (S/A/B/C/D) (Pro)
2,200+
observations matched to regime insights (Pro)
Explore the data
Full dataset access · No signup required · Pro analysis available
ALL · Full price & FNG dataLOGIN USERS · current day insightsPRO USERS · Historic & clustering analysis